一、前言
因为公司项目遇到了一些问题,在debug时需要ftrace进一步debug,由于对ftrace不太了解,故特意学习了一下ftrace。在网络上学习各路大神撰写的文章,收获良多!
计划也撰写一下 Ftrace 文章,一是为了巩固自己的学习,二是为了分享给后来者。
二、什么是ftrace?
Ftrace(Function Tracer)是 Linux 内核自带的轻量级跟踪框架,
能在毫秒级甚至微秒级地记录内核内部发生的事件与函数调用,帮助开发者洞察系统最深处的执行路径、时序瓶颈与异常行为。
Ftrace 是内核自带的调试工具,从久远的 2.6 内核就支持了,由 Steven Rostedt 开发的,从 2008 年发布的内核 2.6.27 中开始就内置了。Ftrace是一个系统内部提供的追踪工具,旨在帮助内核设计和开发人员去追踪系统内部的函数调用流程。
随着Ftrace的不断完善,除了追踪函数调用流程的作用外,还可以用来调试和分析系统的延迟和性能问题,并发展成为一个追踪类调试工具的框架。
根据官方文档,目前支持的 trace 类型:
function
function_graph
blk
hwlat
irqsoff
preemptoff
preemptirqsoff
wakeup
wakeup_rt
wakeup_dl
mmiotrace
branch
nop
具体每个 trace 类型是做什么的,可以查询官方文档。
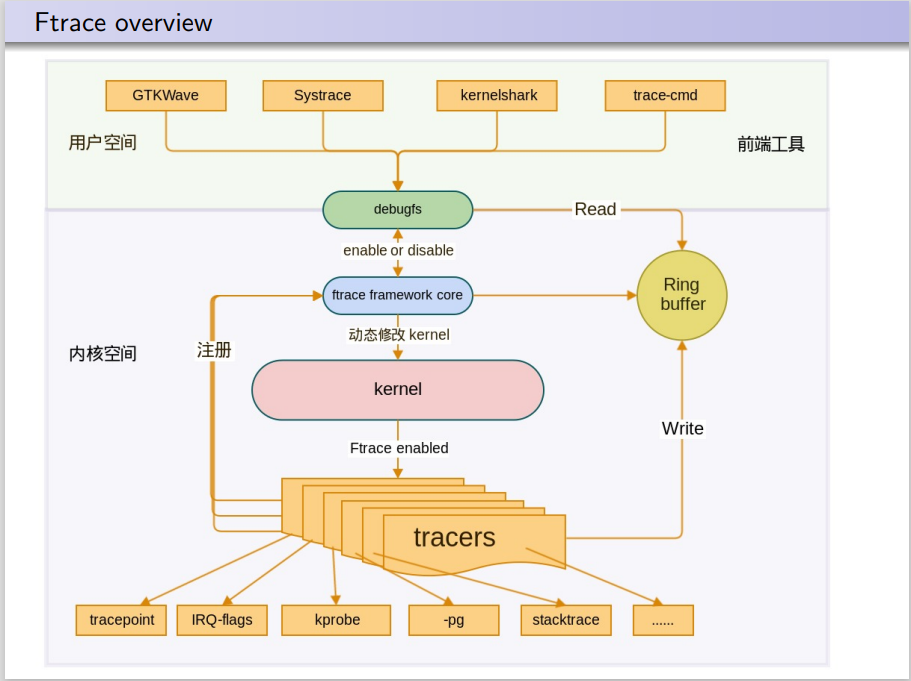
由框架图我们可以知道:
ftrace包括多种类型的tracers,每个tracer完成不同的功能将这些不同类型的
tracers注册进入ftrace framework各类
tracers收集不同的信息,并放入到Ring buffer缓冲区以供调用。
三、ftrace的实现原理
Ftrace采用了静态插桩和动态插桩两种方式来实现。
3.1 静态插桩
我们在Kernel中打开了CONFIG_FUNCTION_TRACER功能后,会增加一个-pg的一个编译选项,这个编译选项的作用就是为每个函数入口处,都会插入bl mcount跳转指令,使得每个函数运行时都会进入mcount函数。
Ftrace一旦使能,对kernel中所有的函数插桩,这带来的性能开销是惊人的,有可能导致人们弃用Ftrace功能。
为了解决这个问题,开发者推出了Dynamic ftrace,以此来优化整体的性能。
3.2 动态插桩
这里的动态,是指的动态修改函数指令。
编译时,记录所有被添加跳转指令的函数,这里表示所有支持追踪的函数。
内核将所有跳转指令替换为
nop指令,以实现非调试状态性能零损失。根据
function tracer设置,动态将被调试函数的nop指令,替换为跳转指令,以实现追踪。
总而言之,Ftrace记录数据可以总结为以下几个步骤:
打开编译选项
-pg,为每个函数都增加跳转指令记录这些可追踪的函数,并为了减少性能消耗,将跳转函数替换为
nop指令通过
flag标志位来动态管理,将需要追踪的函数预留的nop指令替换回追踪指令,记录调试信息。
四、ftrace如何使能?
4.1 defconfig支持
 CONFIG_FTRACE=y                             # 启用了 Ftrace
 CONFIG_FUNCTION_TRACER=y                    # 启用函数级别的追踪器
 CONFIG_HAVE_FUNCTION_GRAPH_TRACER=y         # 表示内核支持图形显示
 CONFIG_FUNCTION_GRAPH_TRACER=y              # 以图形的方式显示函数追踪过程
 CONFIG_STACK_TRACER=y                       # 启用堆栈追踪器,用于跟踪内核函数调用的堆栈信息。
 CONFIG_DYNAMIC_FTRACE=y                     # 启用动态 Ftrace,允许在运行时启用和禁用 Ftrace 功能。
 CONFIG_HAVE_FTRACE_NMI_ENTER=y              # 表示内核支持非屏蔽中断(NMI)时进入 Ftrace 的功能
 CONFIG_HAVE_FTRACE_MCOUNT_RECORD=y          # 表示内核支持通过 mcount 记录函数调用关系。
 CONFIG_FTRACE_NMI_ENTER=y                   # 表示内核支持通过 mcount 记录函数调用关系。
 CONFIG_FTRACE_SYSCALLS=y                    # 系统调用的追踪
 CONFIG_FTRACE_MCOUNT_RECORD=y               # 启用 mcount 记录函数调用关系。
 CONFIG_SCHED_TRACER=y                       # 支持调度追踪
 CONFIG_FUNCTION_PROFILER=y                  # 启用函数分析器,主要用于记录函数的执行时间和调用次数
 CONFIG_DEBUG_FS=y                           # 启用 Debug 文件系统支持
并且上述配置不一定全部打开,勾选自己需要的即可,通常我们选择
CONFIG_FUNCTION_TRACER和CONFIG_HAVE_FUNCTION_GRAPH_TRACER即可。
4.2 挂载debugfs文件系统
Ftrace是基于debugfs调试文件系统的,所以我们的第一步就是先挂载debugfs。
mount -t debugfs none /sys/kernel/debug此时我们能够在/sys/kernel/debug下看到内核支持的所有的调试信息了。
备注:如果debugfs已经开机默认加载,就不需要再执行此步骤。
xxxxx:/sys/kernel/debug # ls -al /sys/kernel/debug
total 0
drwxr-xr-x 108 root root        0 1970-01-01 08:00 .
drwxr-xr-x  30 root root        0 1970-01-01 08:00 ..
drwxr-xr-x   2 root root        0 1970-01-01 08:00 162b000.hsphy
drwxr-xr-x   2 root root        0 1970-01-01 08:00 1c40000.qcom,spmi:qcom,pm7250b@2:qcom,power-on@800
drwxr-xr-x   2 root root        0 1970-01-01 08:00 4804000.ufshc
drwxr-xr-x   2 root root        0 1970-01-01 08:00 4a84000.qcom,qup_uart
drwxr-xr-x   2 root root        0 1970-01-01 08:00 4e00000.ssusb
drwxr-xr-x   2 root root        0 1970-01-08 06:02 adsprpc
drwxr-xr-x   3 root root        0 1970-01-01 08:00 asoc
drwxr-xr-x   2 root root        0 1970-01-08 06:02 at_usb0
drwxr-xr-x   2 root root        0 1970-01-08 06:02 at_usb1
drwxr-xr-x   2 root root        0 1970-01-08 06:02 at_usb2
drwxr-xr-x   2 root root        0 1970-01-08 06:02 battery
drwxr-xr-x   3 root root        0 1970-01-08 06:02 bcl_stats
drwxr-xr-x   2 root root        0 1970-01-01 08:00 bcm7271-uart
drwxr-xr-x 104 root root        0 2025-05-28 11:11 bdi
drwxr-xr-x   3 root root        0 1970-01-01 08:00 binder
drwxr-xr-x 102 root root        0 2025-05-28 11:11 block
drwxr-xr-x   2 root root        0 1970-01-01 08:00 bluetooth
drwxr-xr-x   2 root root        0 1970-01-01 08:00 btt
drwxr-xr-x   2 root root        0 1970-01-08 06:02 cam_cci
drwxr-xr-x   2 root root        0 1970-01-08 06:02 cam_req_mgr
...
...
4.3 Ftrace开启
设置 tracer 类型
进入 ftrace 工作目录
# cd /sys/kernel/debug/tracing

查看系统支持的 tracer 类型
# cat /sys/kernel/debug/tracing/available_tracers
hwlat blk mmiotrace function_graph wakeup_dl wakeup_rt wakeup function nop

设置 tracer 类型为 function
# echo function > /sys/kernel/debug/tracing/current_tracer
设置 tracer 参数
set_ftrace_filter 表示要跟踪的函数,这里我们只跟踪 xxxx 函数
# echo xxxx > /sys/kernel/debug/tracing/set_ftrace_filter
使能 tracer
# echo 1 > /sys/kernel/debug/tracing/tracing_on进行测试
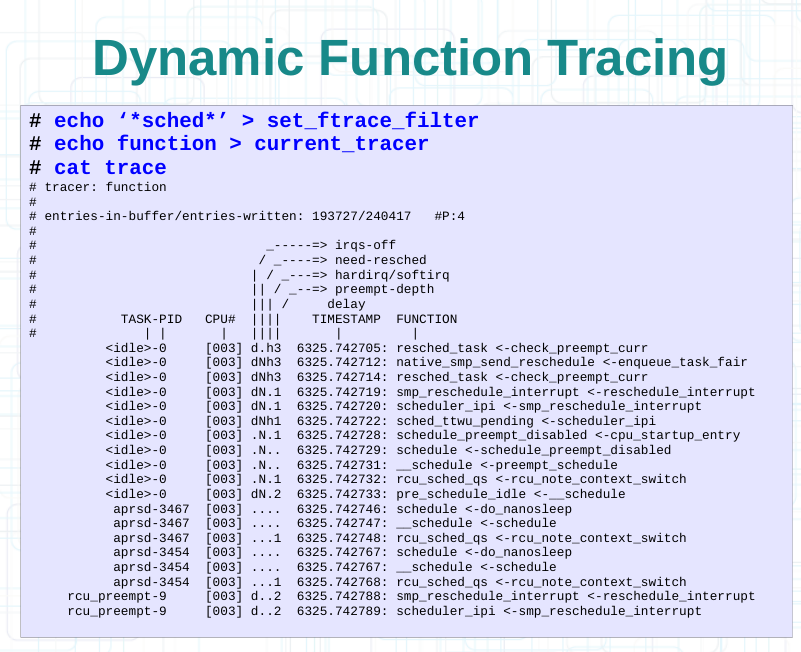
提取 trace 结果
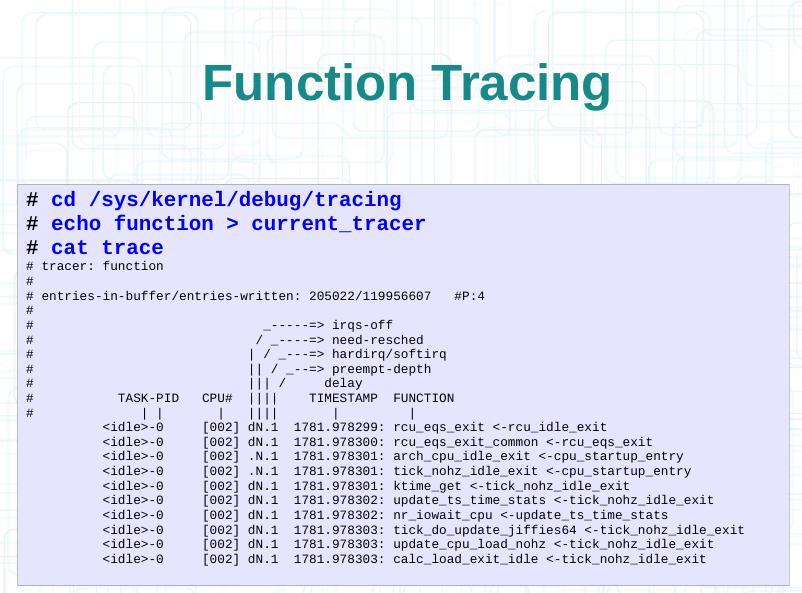
# cat /sys/kernel/debug/tracing/trace
# tracer: function
#
# entries-in-buffer/entries-written: 3/3 #P:4
#
# _-----=> irqs-off
# / _----=> need-resched
# | / _---=> hardirq/softirq
# || / _--=> preempt-depth
# ||| / delay
# TASK-PID CPU# |||| TIMESTAMP FUNCTION
# | | | |||| | |
从 trace 信息我们可以获取很多重要信息:
进程信息,TASK-PID
进程运行的 CPU
执行函数时的系统状态,包括中断,抢占等状态信息
执行函数的时间辍
4.4 函数追踪
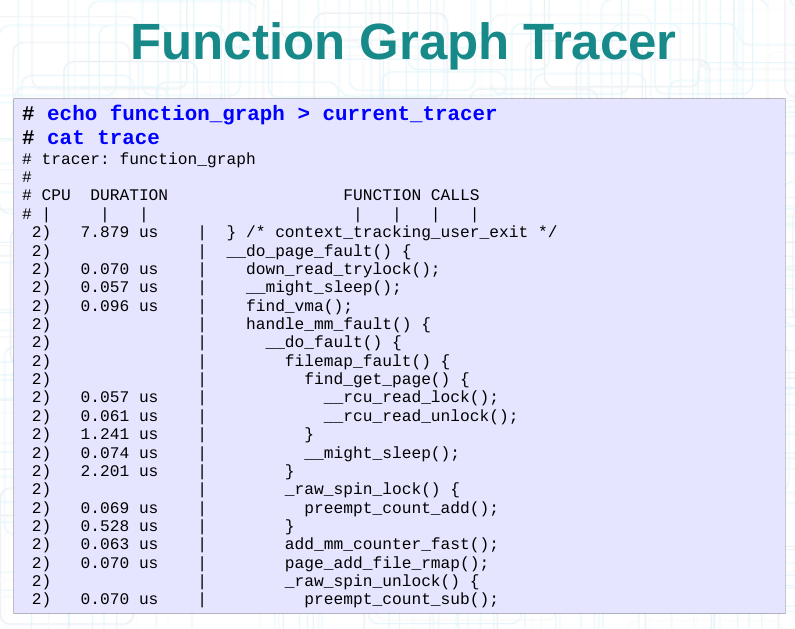
4.5 追踪图形显示
4.6 动态过滤追踪
五、traceing目录介绍
设计人员已经提供了
README文件,里面详解了各个属性文件的含义,我建议直接看官方README文档
这个README文档,位于sys/kernel/debug/tracing/README
xxxx:/sys/kernel/debug/tracing # cat README
tracing mini-HOWTO:

# echo 0 > tracing_on : quick way to disable tracing
# echo 1 > tracing_on : quick way to re-enable tracing

 Important files:
  trace                 - The static contents of the buffer
                          To clear the buffer write into this file: echo > trace
  trace_pipe            - A consuming read to see the contents of the buffer
  current_tracer        - function and latency tracers
  available_tracers     - list of configured tracers for current_tracer
  error_log     - error log for failed commands (that support it)
  buffer_size_kb        - view and modify size of per cpu buffer
  buffer_total_size_kb  - view total size of all cpu buffers

  trace_clock           - change the clock used to order events
       local:   Per cpu clock but may not be synced across CPUs
      global:   Synced across CPUs but slows tracing down.
     counter:   Not a clock, but just an increment
      uptime:   Jiffy counter from time of boot
        perf:   Same clock that perf events use

  timestamp_mode        - view the mode used to timestamp events
       delta:   Delta difference against a buffer-wide timestamp
    absolute:   Absolute (standalone) timestamp

  trace_marker          - Writes into this file writes into the kernel buffer

  trace_marker_raw              - Writes into this file writes binary data into the kernel buffer
  tracing_cpumask       - Limit which CPUs to trace
  instances             - Make sub-buffers with: mkdir instances/foo
                          Remove sub-buffer with rmdir
  trace_options         - Set format or modify how tracing happens
                          Disable an option by prefixing 'no' to the
                          option name
  saved_cmdlines_size   - echo command number in here to store comm-pid list
  dynamic_events                - Create/append/remove/show the generic dynamic events
                          Write into this file to define/undefine new trace events.
  kprobe_events         - Create/append/remove/show the kernel dynamic events
                          Write into this file to define/undefine new trace events.
  uprobe_events         - Create/append/remove/show the userspace dynamic events
                          Write into this file to define/undefine new trace events.
          accepts: event-definitions (one definition per line)
           Format: p[:[<group>/][<event>]] <place> [<args>]
                   r[maxactive][:[<group>/][<event>]] <place> [<args>]
                   s:[synthetic/]<event> <field> [<field>]
                   e[:[<group>/][<event>]] <attached-group>.<attached-event> [<args>] [if <filter>]
                   -:[<group>/][<event>]
            place: [<module>:]<symbol>[+<offset>]|<memaddr>
place (kretprobe): [<module>:]<symbol>[+<offset>]%return|<memaddr>
   place (uprobe): <path>:<offset>[%return][(ref_ctr_offset)]
             args: <name>=fetcharg[:type]
         fetcharg: (%<register>|$<efield>), @<address>, @<symbol>[+|-<offset>],
                   $stack<index>, $stack, $retval, $comm, $arg<N>,
                   +|-[u]<offset>(<fetcharg>), \imm-value, \"imm-string"
             type: s8/16/32/64, u8/16/32/64, x8/16/32/64, string, symbol,
                   b<bit-width>@<bit-offset>/<container-size>, ustring,
                   symstr, <type>\[<array-size>\]
            field: <stype> <name>;
            stype: u8/u16/u32/u64, s8/s16/s32/s64, pid_t,
                   [unsigned] char/int/long
            efield: For event probes ('e' types), the field is on of the fields
                    of the <attached-group>/<attached-event>.
  events/               - Directory containing all trace event subsystems:
      enable            - Write 0/1 to enable/disable tracing of all events
  events/<system>/      - Directory containing all trace events for <system>:
      enable            - Write 0/1 to enable/disable tracing of all <system>
                          events
      filter            - If set, only events passing filter are traced
  events/<system>/<event>/      - Directory containing control files for
                          <event>:
      enable            - Write 0/1 to enable/disable tracing of <event>
      filter            - If set, only events passing filter are traced
      trigger           - If set, a command to perform when event is hit
            Format: <trigger>[:count][if <filter>]
           trigger: traceon, traceoff
                    enable_event:<system>:<event>
                    disable_event:<system>:<event>
                    enable_hist:<system>:<event>
                    disable_hist:<system>:<event>
                    stacktrace
                    hist (see below)
           example: echo traceoff > events/block/block_unplug/trigger
                    echo traceoff:3 > events/block/block_unplug/trigger
                    echo 'enable_event:kmem:kmalloc:3 if nr_rq > 1' > \
                          events/block/block_unplug/trigger
           The first disables tracing every time block_unplug is hit.
           The second disables tracing the first 3 times block_unplug is hit.
           The third enables the kmalloc event the first 3 times block_unplug
             is hit and has value of greater than 1 for the 'nr_rq' event field.
           Like function triggers, the counter is only decremented if it
            enabled or disabled tracing.
           To remove a trigger without a count:
             echo '!<trigger> > <system>/<event>/trigger
           To remove a trigger with a count:
             echo '!<trigger>:0 > <system>/<event>/trigger
           Filters can be ignored when removing a trigger.
      hist trigger      - If set, event hits are aggregated into a hash table
            Format: hist:keys=<field1[,field2,...]>
                    [:<var1>=<field|var_ref|numeric_literal>[,<var2>=...]]
                    [:values=<field1[,field2,...]>]
                    [:sort=<field1[,field2,...]>]
                    [:size=#entries]
                    [:pause][:continue][:clear]
                    [:name=histname1]
                    [:<handler>.<action>]
                    [if <filter>]

            Note, special fields can be used as well:
                    common_timestamp - to record current timestamp
                    common_cpu - to record the CPU the event happened on

            A hist trigger variable can be:
                - a reference to a field e.g. x=current_timestamp,
                - a reference to another variable e.g. y=$x,
                - a numeric literal: e.g. ms_per_sec=1000,
                - an arithmetic expression: e.g. time_secs=current_timestamp/1000

            hist trigger arithmetic expressions support addition(+), subtraction(-),
            multiplication(*) and division(/) operators. An operand can be either a
            variable reference, field or numeric literal.

            When a matching event is hit, an entry is added to a hash
            table using the key(s) and value(s) named, and the value of a
            sum called 'hitcount' is incremented.  Keys and values
            correspond to fields in the event's format description.  Keys
            can be any field, or the special string 'stacktrace'.
            Compound keys consisting of up to two fields can be specified
            by the 'keys' keyword.  Values must correspond to numeric
            fields.  Sort keys consisting of up to two fields can be
            specified using the 'sort' keyword.  The sort direction can
            be modified by appending '.descending' or '.ascending' to a
            sort field.  The 'size' parameter can be used to specify more
            or fewer than the default 2048 entries for the hashtable size.
            If a hist trigger is given a name using the 'name' parameter,
            its histogram data will be shared with other triggers of the
            same name, and trigger hits will update this common data.

            Reading the 'hist' file for the event will dump the hash
            table in its entirety to stdout.  If there are multiple hist
            triggers attached to an event, there will be a table for each
            trigger in the output.  The table displayed for a named
            trigger will be the same as any other instance having the
            same name.  The default format used to display a given field
            can be modified by appending any of the following modifiers
            to the field name, as applicable:

                    .hex        display a number as a hex value
                    .sym        display an address as a symbol
                    .sym-offset display an address as a symbol and offset
                    .execname   display a common_pid as a program name
                    .syscall    display a syscall id as a syscall name
                    .log2       display log2 value rather than raw number
                    .buckets=size  display values in groups of size rather than raw number
                    .usecs      display a common_timestamp in microseconds
                    .percent    display a number of percentage value
                    .graph      display a bar-graph of a value

            The 'pause' parameter can be used to pause an existing hist
            trigger or to start a hist trigger but not log any events
            until told to do so.  'continue' can be used to start or
            restart a paused hist trigger.

            The 'clear' parameter will clear the contents of a running
            hist trigger and leave its current paused/active state
            unchanged.

            The enable_hist and disable_hist triggers can be used to
            have one event conditionally start and stop another event's
            already-attached hist trigger.  The syntax is analogous to
            the enable_event and disable_event triggers.

            Hist trigger handlers and actions are executed whenever a
            a histogram entry is added or updated.  They take the form:

                <handler>.<action>

            The available handlers are:

                onmatch(matching.event)  - invoke on addition or update
                onmax(var)               - invoke if var exceeds current max
                onchange(var)            - invoke action if var changes

            The available actions are:

                trace(<synthetic_event>,param list)  - generate synthetic event
                save(field,...)                      - save current event fields
  events/synthetic_events       - Create/append/remove/show synthetic events
          Write into this file to define/undefine new synthetic events.
             example: echo 'myevent u64 lat; char name[]' >> synthetic_events